Warehouse Statistics
Purpose
The main purpose of this module is to enable the administrator to view the statistics of the warehouses on the system. Admin will be able to view the details of the summary of orders, top-selling items, low stock items, stock summary, reconcile removal/types and ownership transfer, etc.,
Navigation Path
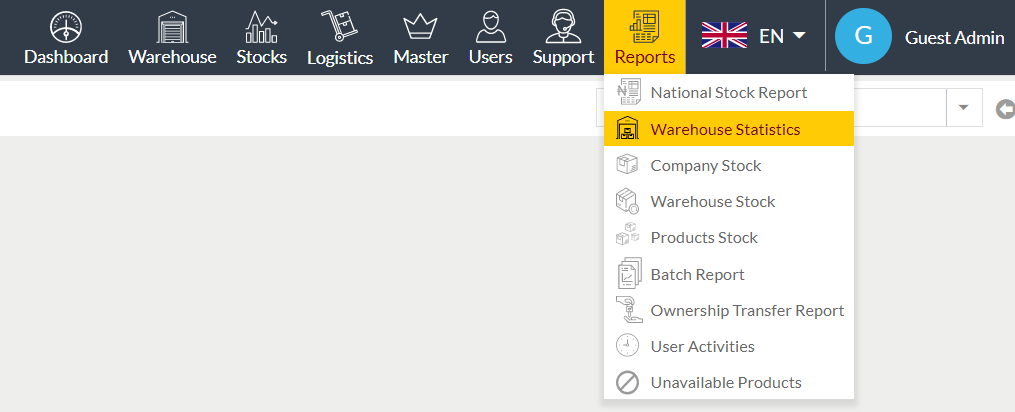
Path: Reports> Warehouse Statistics
Listing Screen
View list of all the summary of orders, top-selling items, low stock item, stock summary, reconcile removal/types and ownership transfer, etc., of the selected warehouse.
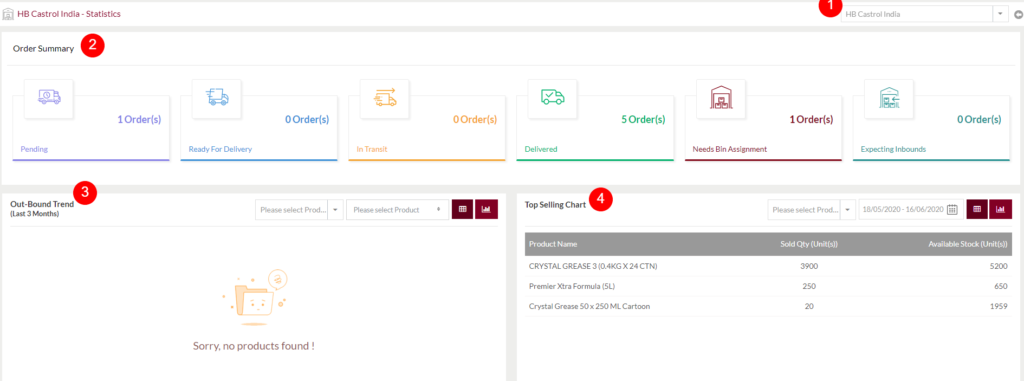
- Search Warehouse: Select the warehouse from the dropdown, based on the selected warehouse the data will be displayed in the listing.
- Order Summary: Order Summary provides a summary of particular warehouse stock-related information like the No.of Pending Stock, a stock that gets ready for delivery, a stock that started for delivery (In Transit), delivered stock, and the units of stock quantity, Expecting stock In-bounds. On clicking the orders all the related information for that particular order will be displayed.
- Out-Bound Trend: Out-Bound Trend provides the last 3 months’ out-bounded stock information (by default). Filters are provided here to filter the results based on the selected Item Owners or items. Here there is a limit for selecting the Item Owners, it is a minimum of 5 and a maximum of 15 Item owners can only be selected. This information is provided in the form of the Data-Grid and Column chart.
- Top Selling Chart: Top Selling Chart provides the information of the last 30 days (By default) top sold items of the particular warehouse. A filter is provided here to filter the result based on the time duration. Another filter is also provided here to filter the result based on the item owner chosen. Here there is a limit for selecting the Item Owners, it is a minimum of 5, and a maximum of 15 Item owners can only be selected. This information is provided in the form of a Column chart.
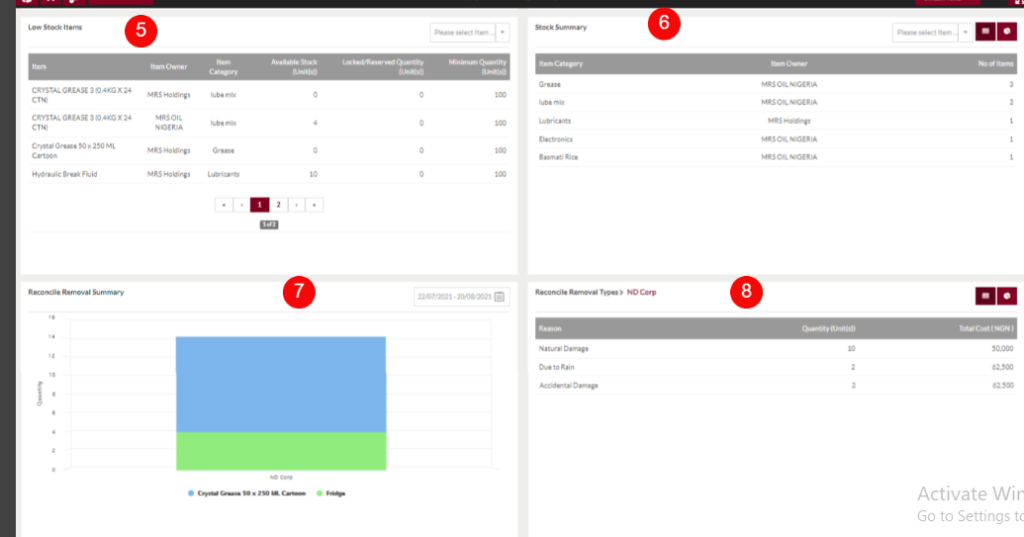
- Low Stock Items: Low Stock Items provide information about low quantity stocks. If the stock quantity is less than the minimum stock quantity in Warehouse inventory then it comes under the Low stock Items. This information is provided in the form of a Data-Grid. A filter is provided here to filter the result based on the Item Owners selected. Here there is a limit for selecting the Item Owner, it is a minimum of 5, and a maximum of 15 Item owners can only be selected.
- Stock Summary: Stock Summary provides the stock information of the particular warehouse. This information is provided in the form of Pie-Chart and Data-Grid. The pie chart shows the Item types and their units. On clicking the Item type, the Item name, and the units of that particular Item will be displayed. Here there is a button “Back to Item type” provided, on clicking the button it gets back to the Item type information. A filter is provided here to filter the result based on the ItemOwners chosen. Here there is a limit for selecting the Item Owner, it is a minimum of 5, and a maximum of 15 item owners can only be selected.
- Reconcile Removal Summary: Reconcile Removal Summary provides a summary of the last 30 days (By default) to reconcile stock information of the particular warehouse. A filter is provided here to filter the result based on the duration of the dates. This information is provided in the form of a Stacked column chart. On hovering the item, it shows how many units of that particular item are wasted among the overall units of reconcile.
- Reconcile Removal Types: Reconcile Removal Types show the different types of reasons for reconciling that happened in a particular warehouse. On hovering the reason, it shows how many units of stock were damaged due to that reason. This information is provided in the form of a Pie-chart and Data-Grid. On clicking the reason in the pie-chart, a column chart will be displayed. This column chart consists of the information on damaged item types and their units. On clicking the item type, it shows all the damaged items and their damaged units. This information is in the form of the Data-Grid and Column chart. On clicking the ‘All Reasons’ it shows all the wastage reasons. Here the Total cost shows the cost of the reconciled stock.
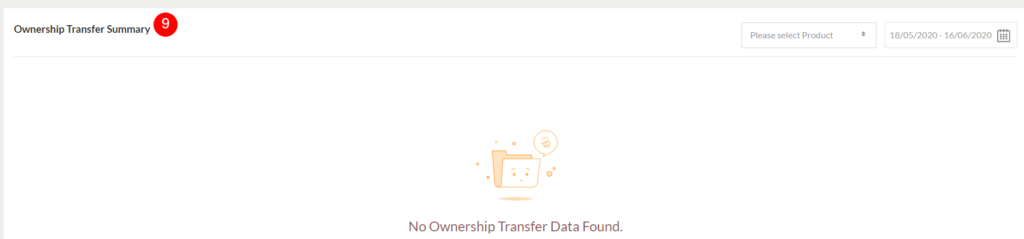
- Ownership Transfer Summary: Provides the summary of the ownership transfer. A filter is provided here to filter the result based on the Item Owners selected and the duration of the ownership transfer dates.